Eritrea
After independence from Italian colonial control in 1941 and 10 years of British administrative control, the UN established Eritrea as an autonomous region within the Ethiopian federation in 1952. Ethiopia’s full annexation of Eritrea as a province 10 years later sparked a violent 30-year struggle for independence that ended in 1991 with Eritrean rebels defeating government forces. Eritreans overwhelmingly approved independence in a 1993 referendum.
ISAIAS Afworki has been Eritrea’s only president since independence; his rule, particularly since 2001, has been highly autocratic and repressive. His government has created a highly militarized society by pursuing an unpopular program of mandatory conscription into national service, sometimes of indefinite length. A two-and-a-half-year border war with Ethiopia that erupted in 1998 ended under UN auspices in December 2000. A UN peacekeeping operation was established that monitored a 25 km-wide Temporary Security Zone. The Eritrea-Ethiopia Boundary Commission (EEBC) created in April 2003 was tasked “to delimit and demarcate the colonial treaty border based on pertinent colonial treaties (1900, 1902, and 1908) and applicable international law.” The EEBC on 30 November 2007 remotely demarcated the border, assigning the town of Badme to Eritrea, despite Ethiopia’s maintaining forces there from the time of the 1998-2000 war. Eritrea insisted that the UN terminate its peacekeeping mission on 31 July 2008. Eritrea has accepted the EEBC’s “virtual demarcation” decision and repeatedly called on Ethiopia to remove its troops.
Ethiopia has not accepted the demarcation decision, and neither party has entered into meaningful dialogue to resolve the impasse. Eritrea is subject to several UN Security Council Resolutions (from 2009, 2011, and 2012) imposing various military and economic sanctions, in view of evidence that it has supported armed opposition groups in the region.
Eritrean Flag
Geography
Location:
Eastern Africa, bordering the Red Sea, between Djibouti and Sudan
Geographic coordinates:
15 00 N, 39 00 E
Map references:
Africa
Area:
total: 117,600 sq km
country comparison to the world: 101
land: 101,000 sq km
water: 16,600 sq km
Area – comparative:
slightly larger than Pennsylvania
Land boundaries:
total: 1,840 km
border countries: Djibouti 125 km, Ethiopia 1,033 km, Sudan 682 km
Coastline:
2,234 km (mainland on Red Sea 1,151 km, islands in Red Sea 1,083 km)
Maritime claims:
territorial sea: 12 nm
Climate:
hot, dry desert strip along Red Sea coast; cooler and wetter in the central highlands (up to 61 cm of rainfall annually, heaviest June to September); semiarid in western hills and lowlands
Terrain:
dominated by extension of Ethiopian north-south trending highlands, descending on the east to
a coastal desert plain, on the northwest to hilly terrain and on the southwest to flat-to-rolling plains
Elevation extremes:
lowest point: near Kulul within the Danakil Depression -75 m
highest point: Soira 3,018 m
Natural resources:
gold, potash, zinc, copper, salt, possibly oil and natural gas, fish
Land use:
arable land: 5.87%
permanent crops: 0.02%
other: 94.12% (2011)
Irrigated land:
215.9 sq km (2003)
Total renewable water resources:
6.3 cu km (2011)
Freshwater withdrawal (domestic/industrial/agricultural):
total: 0.58 cu km/yr (5%/0%/95%)
per capita: 121.3 cu m/yr (2004)
Natural hazards:
frequent droughts, rare earthquakes and volcanoes; locust swarms
volcanism: Dubbi (elev. 1,625 m), which last erupted in 1861, was the country’s only historically active volcano until Nabro (2,218 m) came to life on 12 June 2011
Environment – current issues:
deforestation; desertification; soil erosion; overgrazing; loss of infrastructure from civil warfare
Environment – international agreements:
party to: Biodiversity, Climate Change, Climate Change-Kyoto Protocol, Desertification, Endangered Species, Hazardous Wastes, Ozone Layer Protection
signed, but not ratified: none of the selected agreements
Geography – note:
strategic geopolitical position along world’s busiest shipping lanes; Eritrea retained the entire coastline of Ethiopia along the Red Sea upon de jure independence from Ethiopia on 24 May 1993
People & Society
Nationality:
noun: Eritrean(s)
adjective: Eritrean
Ethnic groups:
nine recognized ethnic groups: Tigrinya 55%, Tigre 30%, Saho 4%, Kunama 2%, Rashaida 2%, Bilen 2%, other (Afar, Beni Amir, Nera) 5% (2010 est.)
Languages:
Tigrinya (official), Arabic (official), English (official), Tigre, Kunama, Afar, other Cushitic languages
Religions:
Muslim, Coptic Christian, Roman Catholic, Protestant
Population:
6,380,803 (July 2014 est.)
country comparison to the world: 107
Age structure:
0-14 years: 40.8% (male 1,307,550/female 1,293,867)
15-24 years: 20.2% (male 644,878/female 646,518)
25-54 years: 31.5% (male 996,856/female 1,014,798)
55-64 years: 3.8% (male 101,549/female 138,016)
65 years and over: 3.7% (male 102,525/female 134,246) (2014 est.)
Dependency ratios:
total dependency ratio: 83.3 %
youth dependency ratio: 79.1 %
elderly dependency ratio: 4.2 %
potential support ratio: 23.7 (2014 est.)
Median age:
total: 19.1 years
male: 18.8 years
female: 19.5 years (2014 est.)
Population growth rate:
2.3% (2014 est.)
country comparison to the world: 38
Birth rate:
30.69 births/1,000 population (2014 est.)
country comparison to the world: 41
Death rate:
7.65 deaths/1,000 population (2014 est.)
country comparison to the world: 111
Net migration rate:
0 migrant(s)/1,000 population (2014 est.)
country comparison to the world: 106
Urbanization:
urban population: 21.3% of total population (2011)
rate of urbanization: 5.01% annual rate of change (2010-15 est.)
Major urban areas – population:
ASMARA (capital) 712,000 (2011)
Sex ratio:
at birth: 1.03 male(s)/female
0-14 years: 1.01 male(s)/female
15-24 years: 1 male(s)/female
25-54 years: 0.98 male(s)/female
55-64 years: 0.98 male(s)/female
65 years and over: 0.79 male(s)/female
total population: 0.98 male(s)/female (2014 est.)
Mother’s mean age at first birth:
20.6
note: median age at first birth among women 25-29 (2002 est.)
Maternal mortality rate:
240 deaths/100,000 live births (2010)
country comparison to the world: 46
Infant mortality rate:
total: 38.44 deaths/1,000 live births
country comparison to the world: 59
male: 43.61 deaths/1,000 live births
female: 33.12 deaths/1,000 live births (2014 est.)
Life expectancy at birth:
total population: 63.51 years
country comparison to the world: 181
male: 61.36 years
female: 65.72 years (2014 est.)
Total fertility rate:
4.14 children born/woman (2014 est.)
country comparison to the world: 35
Contraceptive prevalence rate:
8% (2002)
Health expenditures:
2.6% of GDP (2011)
country comparison to the world: 184
Physicians density:
0.05 physicians/1,000 population (2004)
Hospital bed density:
0.7 beds/1,000 population (2011)
Drinking water source:
improved:
urban: 73.7% of population
rural: 56.7% of population
total: 60.2% of population
unimproved:
urban: 26.3% of population
rural: 43.3% of population
total: 39.8% of population (2008 est.)
Sanitation facility access:
improved:
urban: 51.6% of population
rural: 3.5% of population
total: 13.2% of population
unimproved:
urban: 48.4% of population
rural: 96.5% of population
total: 86.8% of population (2008 est.)
HIV/AIDS – adult prevalence rate:
0.7% (2012 est.)
country comparison to the world: 55
HIV/AIDS – people living with HIV/AIDS:
17,800 (2012 est.)
country comparison to the world: 86
HIV/AIDS – deaths:
1,200 (2012 est.)
country comparison to the world: 71
Major infectious diseases:
degree of risk: high
food or waterborne diseases: bacterial diarrhea, hepatitis A, and typhoid fever
vectorborne diseases: malaria and dengue fever (2013)
Obesity – adult prevalence rate:
1.5% (2008)
country comparison to the world: 188
Children under the age of 5 years underweight:
34.5% (2002)
country comparison to the world: 7
Education expenditures:
2.1% of GDP (2006)
country comparison to the world: 165
Literacy:
definition: age 15 and over can read and write
total population: 68.9%
male: 79.5%
female: 59% (2011 est.)
School life expectancy (primary to tertiary education):
total: 4 years
male: 5 years
female: 4 years (2010)
Government
Country name:
conventional long form: State of Eritrea
conventional short form: Eritrea
local long form: Hagere Ertra
local short form: Ertra
former: Eritrea Autonomous Region in Ethiopia
Government type:
transitional government
note: following a successful referendum on independence for the Autonomous Region of Eritrea on 23-25 April 1993, a National Assembly, composed entirely of the People’s Front for Democracy and Justice or PFDJ, was established as a transitional legislature and a Constitutional Commission was established to draft a constitution; ISAIAS Afworki was named president by the transitional legislature; the constitution, ratified in May 1997, did not enter into effect, pending parliamentary and presidential elections; parliamentary elections were scheduled in December 2001 but were postponed indefinitely; currently the PFDJ is the sole legal party and controls all national, regional, and local political offices
Capital:
name: Asmara (Asmera)
geographic coordinates: 15 20 N, 38 56 E
time difference: UTC+3 (8 hours ahead of Washington, DC, during Standard Time)
Administrative divisions:
6 regions (zobatat, singular – zoba); Anseba, Debub (South), Debubawi K’eyih Bahri (Southern Red Sea), Gash Barka, Ma’akel (Central), Semenawi Keyih Bahri (Northern Red Sea)
Independence:
24 May 1993 (from Ethiopia)
National holiday:
Independence Day, 24 May (1993)
Constitution:
adopted 23 May 1997 (not fully implemented) (2014)
Legal system:
mixed legal system of civil, customary, and Islamic religious law
International law organization participation:
has not submitted an ICJ jurisdiction declaration; non-party state to the ICCt
Suffrage:
18 years of age; universal
Executive branch:
chief of state: President ISAIAS Afworki (since 8 June 1993); note – the president is both the chief of state and head of government and is head of the State Council and National Assembly
head of government: President ISAIAS Afworki (since 8 June 1993)
cabinet: State Council the collective exercises executive authority; members appointed by the president
(For more information visit the World Leaders website Opens in New Window)
elections: president elected by the National Assembly for a five-year term (eligible for a second term); the most recent and only election was held on 8 June 1993 (next election date uncertain as the National Assembly did not hold a presidential election in December 2001 as anticipated)
election results: ISAIAS Afworki elected president by the transitional National Assembly; percent of National Assembly vote – ISAIAS Afworki 95%, other 5%
Legislative branch:
unicameral National Assembly (150 seats; members elected by direct popular vote to serve five-year terms)
elections: in May 1997, following the adoption of the new constitution, 75 members of the PFDJ Central Committee (the old Central Committee of the EPLF), 60 members of the 527-member Constituent Assembly, which had been established in 1997 to discuss and ratify the new constitution, and 15 representatives of Eritreans living abroad were formed into a Transitional National Assembly to serve as the country’s legislative body until countrywide elections to a National Assembly were held; although only 75 of 150 members of the Transitional National Assembly were elected, the constitution stipulates that once past the transition stage, all members of the National Assembly will be elected by secret ballot of all eligible voters; National Assembly elections scheduled for December 2001 were postponed indefinitely due to the war with Ethiopia
Judicial branch:
highest court(s): High Court (organized into civil, commercial, criminal, labor, administrative, and customary sections with 20 judges)
judge selection and term of office: High Court judges appointed by the president
subordinate courts: regional/zonal courts; community courts; special courts; sharia courts (for issues dealing with Muslim marriage, inheritance, and family); military courts
Political parties and leaders:
People’s Front for Democracy and Justice or PFDJ [ISAIAS Afworki] (the only party recognized by the government); note – a National Assembly committee drafted a law on political parties in January 2001, but the full National Assembly never debated or voted on it
Political pressure groups and leaders:
Democratic Movement for the Liberation of Eritrean Kunama (DMLEK)
Eritrean Democratic Alliance (EDA)
Eritrean National Congress for Democratic Change (ENCDC)
Eritrean National Salvation Front (ENSF)
Eritrean Islamic Party for Justice and Development (EIPJD) (includes the Eritrean Islamic Jihad (EIJ), Eritrean Islamic Jihad Movement (EIJM), Eritrean Islamic Salvation, and the Eritrean Islamic Foundation)
Eritrean People’s Democratic Party (EPDP)
Red Sea Afar Democratic Organization (RSADO)
International organization participation:
ACP, AfDB, AU, COMESA, FAO, G-77, IAEA, IBRD, ICAO, ICC (NGOs), IDA, IFAD, IFC, IFRCS (observer), ILO, IMF, IMO, Interpol, IOC, ISO (subscriber), ITU, ITUC (NGOs), LAS (observer), MIGA, NAM, OPCW, PCA, UN, UNCTAD, UNESCO, UNIDO, UNWTO, UPU, WCO, WFTU (NGOs), WHO, WIPO, WMO
Diplomatic representation in the US:
chief of mission: Ambassador (vacant); Charge d’Affaires BERHANE Gebrehiwet Solomon (since 15 March 2011)
chancery: 1708 New Hampshire Avenue NW, Washington, DC 20009
telephone: [1] (202) 319-1991
FAX: [1] (202) 319-1304
Diplomatic representation from the US:
chief of mission: Ambassador (vacant); Charge d’Affaires Sue BREMNER (since July 2012)
embassy: 179 Ala Street, Asmara
mailing address: P. O. Box 211, Asmara
telephone: [291] (1) 120004
FAX: [291] (1) 127584
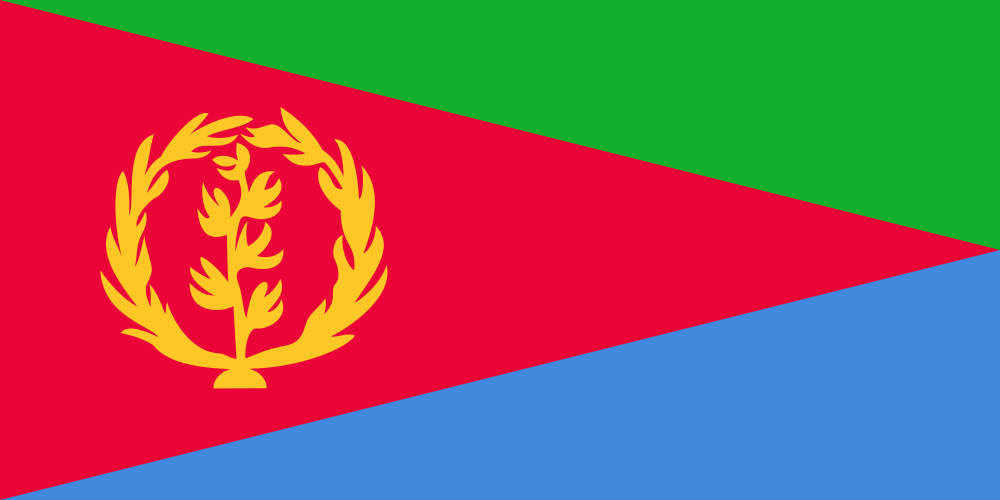
Flag description:
red isosceles triangle (based on the hoist side) dividing the flag into two right triangles; the upper triangle is green, the lower one is blue; a gold wreath encircling a gold olive branch is centered on the hoist side of the red triangle; green stands for the country’s agriculture economy, red signifies the blood shed in the fight for freedom, and blue symbolizes the bounty of the sea; the wreath-olive branch symbol is similar to that on the first flag of Eritrea from 1952; the shape of the red triangle broadly mimics the shape of the country
National symbol(s):
camel
National anthem:
name: “Ertra, Ertra, Ertra” (Eritrea, Eritrea, Eritrea)
Economy
Economy – overview:
Since formal independence from Ethiopia in 1993, Eritrea has faced many economic problems, including lack of resources and chronic drought, which have been exacerbated by restrictive economic policies. Eritrea has a command economy under the control of the sole political party, the People’s Front for Democracy and Justice (PFDJ). Like the economies of many African nations, a large share of the population – nearly 80% – is engaged in subsistence agriculture, but the sector only produces a small share of the country’s total output.
Since the conclusion of the Ethiopian-Eritrea war in 2000, the government has expanded use of military and party-owned businesses to complete President ISAIAS’s development agenda. The government has strictly controled the use of foreign currency by limiting access and availability; new regulations in 2013 have slightly relaxed currently controls. Few large private enterprises exist in Eritrea and most operate in conjunction with government partners, including a number of large international mining ventures that have recently begun production.
While reliable statistics on food security are difficult to obtain, erratic rainfall and the percentage of the labor force tied up in national service continue to interfere with agricultural production and economic development. Eritrea’s harvests generally cannot meet the food needs of the country without supplemental grain purchases. Copper, potash, and gold production is likely to drive economic growth over the next few years, but military spending will continue to compete with development and investment plans.
Eritrea’s economic future will depend on market reform, international sanctions, global food prices, and success at addressing social problems such as illiteracy and low skills.
GDP (purchasing power parity):
$4.717 billion (2013 est.)
country comparison to the world: 172
$4.409 billion (2012 est.)
$4.12 billion (2011 est.)
note: data are in 2013 US dollars
GDP (official exchange rate):
$3.438 billion (2013 est.)
GDP – real growth rate:
7% (2013 est.)
country comparison to the world: 20
7% (2012 est.)
8.7% (2011 est.)
GDP – per capita (PPP):
$1,200 (2013 est.)
country comparison to the world: 212
$1,100 (2012 est.)
$1,100 (2011 est.)
note: data are in 2013 US dollars
Gross national saving:
13% of GDP (2013 est.)
country comparison to the world: 119
10.9% of GDP (2012 est.)
5.3% of GDP (2011 est.)
GDP – composition, by end use:
household consumption: 75.1%
government consumption: 18.4%
investment in fixed capital: 15.7%
exports of goods and services: 10.2%
imports of goods and services: -19.4%
(2013 est.)
GDP – composition, by sector of origin:
agriculture: 11.7%
industry: 26.9%
services: 61.4% (2013 est.)
Agriculture – products:
sorghum, lentils, vegetables, corn, cotton, tobacco, sisal; livestock, goats; fish
Industries:
food processing, beverages, clothing and textiles, light manufacturing, salt, cement
Industrial production growth rate:
7% (2013 est.)
country comparison to the world: 36
Labor force:
2.955 million (2012 est.)
country comparison to the world: 104
Labor force – by occupation:
agriculture: 80%
industry and services: 20% (2004 est.)
Unemployment rate:
NA%
Population below poverty line:
50% (2004 est.)
Household income or consumption by percentage share:
lowest 10%: NA%
highest 10%: NA%
Budget:
revenues: $968.8 million
expenditures: $1.417 billion (2013 est.)
Taxes and other revenues:
28.2% of GDP (2013 est.)
country comparison to the world: 103
Budget surplus (+) or deficit (-):
-13% of GDP (2013 est.)
country comparison to the world: 212
Public debt:
104.7% of GDP (2013 est.)
country comparison to the world: 14
125.8% of GDP (2012 est.)
Fiscal year:
calendar year
Inflation rate (consumer prices):
13% (2013 est.)
country comparison to the world: 216
17% (2012 est.)
Commercial bank prime lending rate:
NA%
Stock of narrow money:
$1.798 billion (31 December 2013 est.)
country comparison to the world: 129
$1.396 billion (31 December 2012 est.)
Stock of broad money:
$4.077 billion (31 December 2013 est.)
country comparison to the world: 135
$3.11 billion (31 December 2012 est.)
Stock of domestic credit:
$3.602 billion (31 December 2013 est.)
country comparison to the world: 121
$2.777 billion (31 December 2012 est.)
Current account balance:
-$210.1 million (2013 est.)
country comparison to the world: 86
$174.5 million (2012 est.)
Exports:
$496.2 million (2013 est.)
country comparison to the world: 174
$454.9 million (2012 est.)
Exports – commodities:
livestock, sorghum, textiles, food, small manufactures
Imports:
$1.027 billion (2013 est.)
country comparison to the world: 178
$972.8 million (2012 est.)
Imports – commodities:
machinery, petroleum products, food, manufactured goods
Reserves of foreign exchange and gold:
$192.9 million (31 December 2013 est.)
country comparison to the world: 160
$174.4 million (31 December 2012 est.)
Debt – external:
$1.094 billion (31 December 2013 est.)
country comparison to the world: 160
$1.057 billion (31 December 2012 est.)
Exchange rates:
nakfa (ERN) per US dollar –
15.38 (2013 est.)
15.375 (2012 est.)
15.375 (2010 est.)
15.375 (2009)
15.38 (2008)
Cincinnati Connection

Check back soon for more!